Unaudited Portfolio Returns (Summaries)
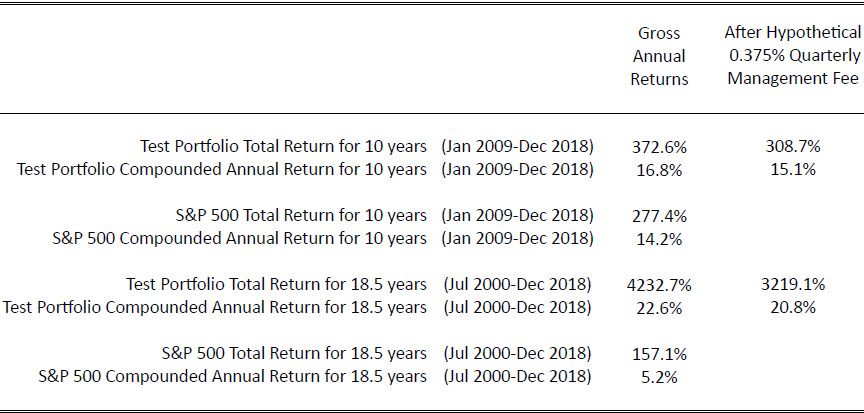
After Hypothetical 0.375% Quarterly Management Fee
Benchmarked to S&P 500 (Commissions and Fees NOT Included)
References (S&P 500)
(1) https://dqydj.com/sp-500-return-calculator/
(2) https://www.slickcharts.com/sp500/returns
2000-2018 Results
- Test Portfolio Performance Statements for July 2000 through December 2018 may be viewed here.
- Brokerage statements for July 2000 through December 2018 may be viewed here.
 Beginning in July 2000, when he became a full-time investor, the bulk of Bill Matson’s securities portfolio was designated as a “Test Portfolio” (TP), in order to track the efficacy of those principles detailed in the Data Driven Investing book he co-authored. Click here to obtain a digital copy of the book.
The TP’s results have been encouraging, with gross returns of 4233% between July 2000 and December 2018, which equates to 3219% after imposition of a hypothetical 0.375% quarterly fee on assets under management. On a compounded annual basis, returns for this period were 22.6% and 20.8%, respectively. Average annual returns were 29.5% and 27.7%.
Those who might contemplate an investment strategy based on the principles of Data Driven Investing should keep in mind that such strategies may underperform market indices by significant margins for extended periods. Moreover, past performance does not guarantee future performance; there can be no assurance that the next 18 ½ years will mirror the past 18 ½.
Due to a perfect storm of favorable circumstances, the TP turned in spectacular results for the July 2000 through March 2004 (45 month) period documented in Data Driven Investing. Its gross returns were 833%, 788% after imposition of the hypothetical 0.375% quarterly fee. On a compounded annual basis, returns for this period were 81.4% and 79.0%, respectively.
These results were largely attributable to:
- A focus on small company value stocks at a time when such stocks were enjoying extremely strong returns, and
- Liberal use of margin borrowing and derivative securities, which tended to magnify Bill’s returns.
From April 2004 through December 2018, annual returns were significantly lower. Gross returns were still a respectable 364% (273% after imposition of the hypothetical 0.375% quarterly fee). On a compounded annual basis, returns for this period were 11.0% and 9.4%, respectively. This decline in performance was mainly attributable to:
- Lower returns on small cap value stocks than those prevailing during the preceding 45 months,
- Losses in the TP of approximately 60% between November 2007 and February 2009,
- Significantly less net exposure to equities since late 2008, as a result of Bill becoming more risk averse (for personal reasons unrelated to market timing considerations), and
- Paying full service commissions between January 2012 and May 2013, when he was employed by a major full-service brokerage.
Additional performance-related disclosures are presented below and in the Data Driven Investing book. Understanding of all such disclosures is a critically important prerequisite to understanding the conclusions that may be drawn from the TP’s performance history.
Return Calculation Methodology:
The TP’s performance history includes all taxable brokerage accounts that:
- maintained balances exceeding $100,000 for at least one complete calendar month between July 2000 and March 2004, and
- were 100%-owned and fully controlled by Bill.
During months when Bill had two such accounts, as was the case between 2004 and 2007, we have consolidated their statement data.
At no time did Bill’s non-taxable accounts exceed 25% of his total brokerage account balances.
Our performance calculations assume that all deposits are made at the beginning of the month and all withdrawals are made at the end of the month. As a result, positive monthly returns tend to be slightly understated and negative monthly returns tend to be slightly worse than presented. Overall returns, however, are significantly understated due to the preponderance of positive monthly returns.
These calculations assume reinvestment of all dividends and zero taxes.
The Data Driven Investing book indicated 2003 returns of 157.0%. Due to rounding, this figure differs from the 157.1% figure shown elsewhere on this site.
The period documented in the Data Driven Investing book was an unusually profitable time for small cap value investing. Returns since that time have been significantly lower, for small cap value stocks, as well as for this portfolio.
Due to its option purchases and sales, margin borrowing, and significant positions in small cap, often illiquid stocks, this portfolio’s strategies entail a high degree of risk and may not be appropriate or suitable for some investors.
Neither Bill nor any organization with which he is affiliated are currently offering products that are likely to duplicate this portfolio’s returns. Consequently, its past performance should not be relied upon in any way as being indicative of future returns that these parties are likely to achieve.
Past performance does not guarantee future performance.
Sources of brokerage statements are Fidelity, TD Ameritrade (TDA), and a large St. Louis-based firm where Bill had an account from January 2012 through mid-2013 which has requested that we not refer to it by name.
Fidelity, TD Ameritrade, and that large St. Louis-based firm are not responsible for the subject matter of this site and have not reviewed its content for accuracy. They have not examined, nor do they endorse, any trading strategy discussed on this site. The Fidelity Investments and Pyramid Logo is a registered trademark of FMR Corp.